Author: Manuel Lemos
Viewers: 222
Last month viewers: 1
Categories: PHP Tutorials, PHP Performance, Sponsored
Visual tools can help you as an application developer to view and interpret the current performance values, so you can compare those values before and after you make code changes, so you can confirm that your application will really run faster after you make those code changes.
Read this short article to learn more about how to visualize the performance values of your Laravel or Symfony applications any time you want using the Scout APM tool for free.
In this article you will learn about:
1. What Are Useful Web Application Performance Metric Values
1.1 PHP Script Execution Time
1.2 Page Download Time
2. Why You Need to Visualize Your Current Performance Metric Values
3. How Can Visualize Your Site Performance Metric Values Using the Scout Application Performance Monitoring Tool
1. What Are Useful Web Application Performance Metric Values
1.1 PHP Script Execution Time
When you try to measure the performance of Web application, you should see it from the point of view of the application users.
Your code may run really fast, but in some cases the users still see your site as slow.
This may happen for instance if you have slow database queries. In this case your Web application pages will not appear to the user until the PHP scripts that generate the pages ends.
So one of the most important metrics is the time that a PHP script takes to execute.
The PHP script execution time depends on how you implement the script code.
1.2 Page Download Time
Still after the PHP script is executed, the generated pages HTML, CSS, JavaScript and images will take even more time to be served to the users' browsers.
The page download time depends on how you structure the page content.
2. Why You Need to Visualize Your Current Performance Metric Values
When you want to improve the performance of your PHP script code, there are many types issues that affect the speed of execution.
Just looking at your code, it may be hard to figure where you can change the code improve the code speed of execution.
If you use a good visualization method that shows the structure of your code and pinpoints the slow parts, it becomes easier to find the code that it is slow.
3. How Can Visualize Your Site Performance Values Using the Scout Application Performance Monitoring Tool
If you use your own framework or development methods, only you know what is the structure of your project.
Now if you use well-known frameworks to develop your PHP applications, you may use third-party tools to analyse your application as long as those tools understand the structure of your projects.
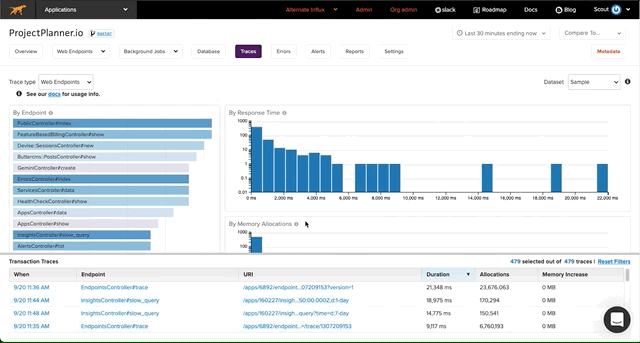
Fortunately for you, if you use Laravel or Symfony frameworks to develop your PHP projects, you can use the Scout Application Performance Monitoriing tool to visualized the performance of the different parts of your code.
Scout is an application performance monitoring application that supports many Web programming languages, including PHP. If you used Laravel or Symfony, to build your application it provides good support to find the code that needs to be fixed to solve the slow request problems.

So for now I suggest that you try the Scout Application Monitoring with PHP support. You can try it for free for 14 days. That time will be enough for you to test this feature to help you quickly find the PHP code that causes the slow request problem. Just go to the Scout signup for free trial page, so you can start trying it for free now.
So now, I invite you to try it by going to the Scout signup for free trial page so you can experience the benefits of this application without paying.
You need to be a registered user or login to post a comment
Login Immediately with your account on:
Comments:
No comments were submitted yet.


